Using OpenSearch to monitor client's state in real time
Initial challenge: We want to monitor client's state in real time. It is possible to solve this challenge using OpenSearch stack.
We have a data we want to analyse in csv format. The architecture could look like this:
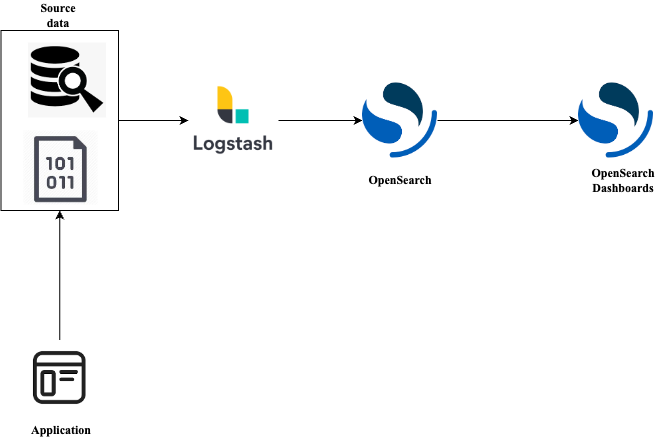
For example, our application continuously writes data into the csv file. We are using Logstash to stream this data to our OpenSearch nodes, and later use OpenSearch dashboards to visualize and analyse the data. And since Logstash is designed to continuously stream data, it allows us to get an insight into the client's state in real time.
What is OpenSearch?
OpenSearch is an open-source software designed for search, observability, analytics and visualisation. OpenSearch allows us to perform full-text search on our data, search by fields, sort and aggregate. Then we can visualize our data with OpenSearch Dashboards. OpenSearch Dashboards is an open-source tool for real-time application data visualisation and monitoring, with the help of various graphs and charts we can observe trends and patterns in our data and act accordingly.
What is Logstash?
Logstash is an open source data collection engine with real-time pipelining capabilities. With logstash we can ingest data to our preferable destination from variety of sources. It is also possible to transform data during the transfer to prepare it for future visualisation.
Those technologies allow us to monitor client state in real-time based on our data.
Implementation
OpenSearch is a distributed system. It means that we interact with clusters, which consist of nodes. One node represent a server that store our data and process our request. For our demo we are going to create a cluster with three nodes: two for the OpenSearch itself, and one more for OpenSearch Dashboards.
To deploy our demo cluster we are going to use sample docker-compose file provided by OpenSearch documentation with a few modifications. We are adding a Logstash container to the docker-compose which will be responsible for data ingestion.
1 version: '3'
2 services:
3  opensearch-node1: # This is also the hostname of the container within the Docker network (i.e. <https://opensearch-node1/>)
4    image: opensearchproject/opensearch:latest
5    container_name: opensearch-node1
6    environment:
7      - cluster.name=opensearch-cluster # Name the cluster
8      - node.name=opensearch-node1 # Name the node that will run in this container
9      - discovery.seed_hosts=opensearch-node1,opensearch-node2 # Nodes to look for when discovering the cluster
10      - cluster.initial_cluster_manager_nodes=opensearch-node1,opensearch-node2 # Nodes eligibile to serve as cluster manager
11      - bootstrap.memory_lock=true # Disable JVM heap memory swapping
12      - "OPENSEARCH_JAVA_OPTS=-Xms512m -Xmx512m" # Set min and max JVM heap sizes to at least 50% of system RAM
13    ulimits:
14      memlock:
15        soft: -1 # Set memlock to unlimited (no soft or hard limit)
16        hard: -1
17      nofile:
18        soft: 65536 # Maximum number of open files for the opensearch user - set to at least 65536
19        hard: 65536
20    volumes:
21      - opensearch-data1:/usr/share/opensearch/data # Creates volume called opensearch-data1 and mounts it to the container
22    ports:
23      - 9200:9200 # REST API
24      - 9600:9600 # Performance Analyzer
25    networks:
26      - opensearch-net # All of the containers will join the same Docker bridge network
27  opensearch-node2:
28    image: opensearchproject/opensearch:latest # This should be the same image used for opensearch-node1 to avoid issues
29    container_name: opensearch-node2
30    environment:
31      - cluster.name=opensearch-cluster
32      - node.name=opensearch-node2
33      - discovery.seed_hosts=opensearch-node1,opensearch-node2
34      - cluster.initial_cluster_manager_nodes=opensearch-node1,opensearch-node2
35      - bootstrap.memory_lock=true
36      - "OPENSEARCH_JAVA_OPTS=-Xms512m -Xmx512m"
37    ulimits:
38      memlock:
39        soft: -1
40        hard: -1
41      nofile:
42        soft: 65536
43        hard: 65536
44    volumes:
45      - opensearch-data2:/usr/share/opensearch/data
46    networks:
47      - opensearch-net
48  opensearch-dashboards:
49    image: opensearchproject/opensearch-dashboards:latest # Make sure the version of opensearch-dashboards matches the version of opensearch installed on other nodes
50    container_name: opensearch-dashboards
51    ports:
52      - 5601:5601 # Map host port 5601 to container port 5601
53    expose:
54      - "5601" # Expose port 5601 for web access to OpenSearch Dashboards
55    environment:
56      OPENSEARCH_HOSTS: '["<https://opensearch-node1:9200","https://opensearch-node2:9200"]'> # Define the OpenSearch nodes that OpenSearch Dashboards will query
57    volumes:
58      - ./opensearch_dashboards.yml:/usr/share/opensearch-dashboards/config/opensearch_dashboards.yml
59    networks:
60      - opensearch-net
61  logstash:
62    image: opensearchproject/logstash-oss-with-opensearch-output-plugin:latest
63    container_name: logstash
64    volumes:
65      - ~/Downloads/opensearch-playground/logstash:/usr/share/logstash/pipeline
66      - ~/Downloads/opensearch-playground/data:/usr/share/cussas-data
67      - ~/Downloads/opensearch-playground/logstash.yml:/usr/share/logstash/config/logstash.yml
68    networks:
69      - opensearch-net # We deploy it to the same network as our OpeanSearch nodes
70
71 volumes:
72  opensearch-data1:
73  opensearch-data2:
74
75 networks:
76  opensearch-net:
We have added Logstash to it and deployed it to the same network. We also need to mount some volumes to the Logstash container:
-
logstash.conf- here we will describe the configuration of our pipeline1 input { 2 file { 3 path => "/usr/share/cussas-data/results.csv" 4 start_position => beginning 5 sincedb_path => "NUL" 6 } 7 } 8 filter { 9 csv { 10 columns => [ 11 "Action", 12 "Action_CLV", 13 "CLV_Segment", 14 "CLV", 15 "Cohort", 16 "Period", 17 "Client ID", 18 "First order date", 19 "Last order date", 20 "Transaction count", 21 "Client total sum", 22 "Average order sum", 23 "Dormant time, days", 24 "Lifetime, days", 25 "Interaction time, days", 26 "RFM", 27 "ABC-group", 28 "Order frequency", 29 "Expected order time, days", 30 "Expected order time, months", 31 "Lifetime, months", 32 "Interaction time, months", 33 "Time between 1 and 2 orders, days", 34 "Dormant time, months", 35 "Lifecycle segment", 36 "Previous lifecycle segment", 37 "RFM-segment", 38 "Date" 39 40 ] 41 separator => ";" 42 } 43 mutate { 44 remove_field => [ "message", "path" ] 45 convert => { 46 "CLV" => "float" 47 "Cohort" => "integer" 48 "Transaction count" => "integer" 49 "Client total sum" => "integer" 50 "Average order sum" => "float" 51 "Dormant time, days" => "integer" 52 "Lifetime, days" => "integer" 53 "Interaction time, days" => "integer" 54 "RFM" => "integer" 55 "Order frequency" => "float" 56 "Expected order time, days" => "float" 57 "Expected order time, months" => "float" 58 "Lifetime, months" => "integer" 59 "Interaction time, months" => "integer" 60 "Time between 1 and 2 orders, days" => "integer" 61 "Dormant time, months" => "integer" 62 } 63 } 64 date { 65 match => ["Period", "MM/dd/YYYY"] 66 target => "Period" 67 } 68 date { 69 match => ["Date", "MM/dd/YYYY"] 70 target => "Date" 71 } 72 date { 73 match => ["First order date", "MM/dd/YYYY"] 74 target => "First order date" 75 } 76 date { 77 match => ["Last order date", "MM/dd/YYYY"] 78 target => "Last order date" 79 } 80 } 81 output { 82 stdout 83 { 84 codec => rubydebug 85 } 86 opensearch { 87 action => "index" 88 hosts => ["<https://opensearch-node1:9200",> "<https://opensearch-node2:9200"]> 89 index => "cussas-data" 90 user => "admin" 91 password => "admin" 92 ssl => true 93 ssl_certificate_verification => false 94 } 95 }logstash.conf is divided into 3 sections: input, filter, output.
INPUT
In this section we define the input source for our pipeline. In our case we specify that we would like to use file as a source. We provide absolute path to the file, preferable starting position and the location where logstash will store the info about last read line.
FILTER
Here we use CSV plugin and explicitly mention all the columns and separator for our data. Next with the mutate plugin we remove extra fields added by Logstash, since we do not need them in our case. By default, all the columns are treated as strings and if we want to use some of them, for example, for aggregation we need to convert some fields to proper data types. We do this by using convert. And lastly, we convert the fields that contain date by using date plugin with the appropriate format.
OUTPUT
In the output section we specify our destination, in our case OpenSearch. stdout section is for debugging.
-
logstash.yml- here we are disabling ecs_compatibility to get rid of some of redundant fields.1 http.host: "0.0.0.0" 2 pipeline.ecs_compatibility: disabled
Since Logstash 8.0 this setting is on by default, we disable it here to remove the field which duplicates the message send to add data to OpenSearch.
-
results.csv- is our csv file with the data we want to use
Now we can run docker to start our cluster:
docker-compose -f docker-compose.yml up
Working with OpenSearch console
Everything should be up and running now. Firstly, let's verify that our data is ingested to OpenSearch:
Open http://localhost:5601/ in browser and login.
In the console execute request the following to see that our index is created:
GET _cat/indices
In the response we should see the index with the name we specified previously. The response could look like this:
1 green open security-auditlog-2022.12.15    4xhB1Et6RN6dA9IiJKPGlg 1 1    30 0 366.2kb 174.9kb
2 green open security-auditlog-2022.12.23    _d_9m8jGTcam9iC2UWRhDQ 1 1   894 0   2.7mb   1.4mb
3 green open cusaas-data                     6ll_TX8xTLWz6t1Q1LnH8g 1 1 20063 0  12.5mb   6.3mb
4 green open security-auditlog-2022.12.14    7Ku2-bj3TWWVb3d7fmvmSg 1 1   895 0   2.8mb   1.4mb
5 green open security-auditlog-2022.12.24    kczt0RDmSD-rerojNkeTaQ 1 1   462 0   1.4mb 735.6kb
6 green open security-auditlog-2022.12.30    5yEJ4Hw8SxyfcaqNLw4xww 1 1    12 0 200.6kb 166.5kb
7 green open security-auditlog-2022.12.21    CRIdhzm_TnaMHKOnc5X5zw 1 1    68 0 245.6kb 100.8kb
Execute simple search request:
1 GET cusaas-data/_search/
2 {
3     "query": {
4         "match": {
5             "Lifetime,  days": 20
6         }
7     }
8 }
Here we are searching for the data where the field Lifetime, days is equal to 20. We can see the ingested data in response:
1 {
2  "took" : 11,
3  "timed_out" : false,
4  "_shards" : {
5    "total" : 1,
6    "successful" : 1,
7    "skipped" : 0,
8    "failed" : 0
9  },
10  "hits" : {
11    "total" : {
12      "value" : 18,
13      "relation" : "eq"
14    },
15    "max_score" : 1.0,
16    "hits" : [
17      {
18        "_index" : "cussas-data",
19        "_id" : "XIaSU4UB-xSWDumAfiFp",
20        "_score" : 1.0,
21        "_source" : {
22          "CLV_Segment" : null,
23          "Interaction time,  days" : 1204,
24          "Cohort" : 223,
25          "Order frequency" : 4.5,
26          "Dormant time,  months" : 38,
27          "Previous lifecycle segment" : "churn ",
28          "RFM-segment" : null,
29          "Dormant time, days" : 1184,
30          "Expected order time, days" : 10.0,
31          "Interaction time,  months" : 39,
32          "host" : "f97451f2daab",
33          "RFM" : null,
34          "Period" : "2021-12-01T00:00:00.000Z",
35          "Lifetime,  days" : 20,
36          "Transaction count" : 3,
37          "Client total sum" : 645,
38          "Last order date" : "2018-09-04T00:00:00.000Z",
39          "Action" : null,
40          "Average order sum" : 215.073333333333,
41          "Action_CLV" : null,
42          "Date" : "2021-12-01T00:00:00.000Z",
43          "ABC-group" : "A",
44          "Expected order time, months" : 0.0,
45          "First order date" : "2018-08-15T00:00:00.000Z",
46          "Time between 1 and 2 orders, days" : 16,
47          "@version" : "1",
48          "Lifecycle segment" : "churn",
49          "@timestamp" : "2022-12-27T12:33:05.679116927Z",
50          "Client ID" : "D507618",
51          "Lifetime,  months" : 0,
52          "CLV" : null
53        }
54      },
55      .......
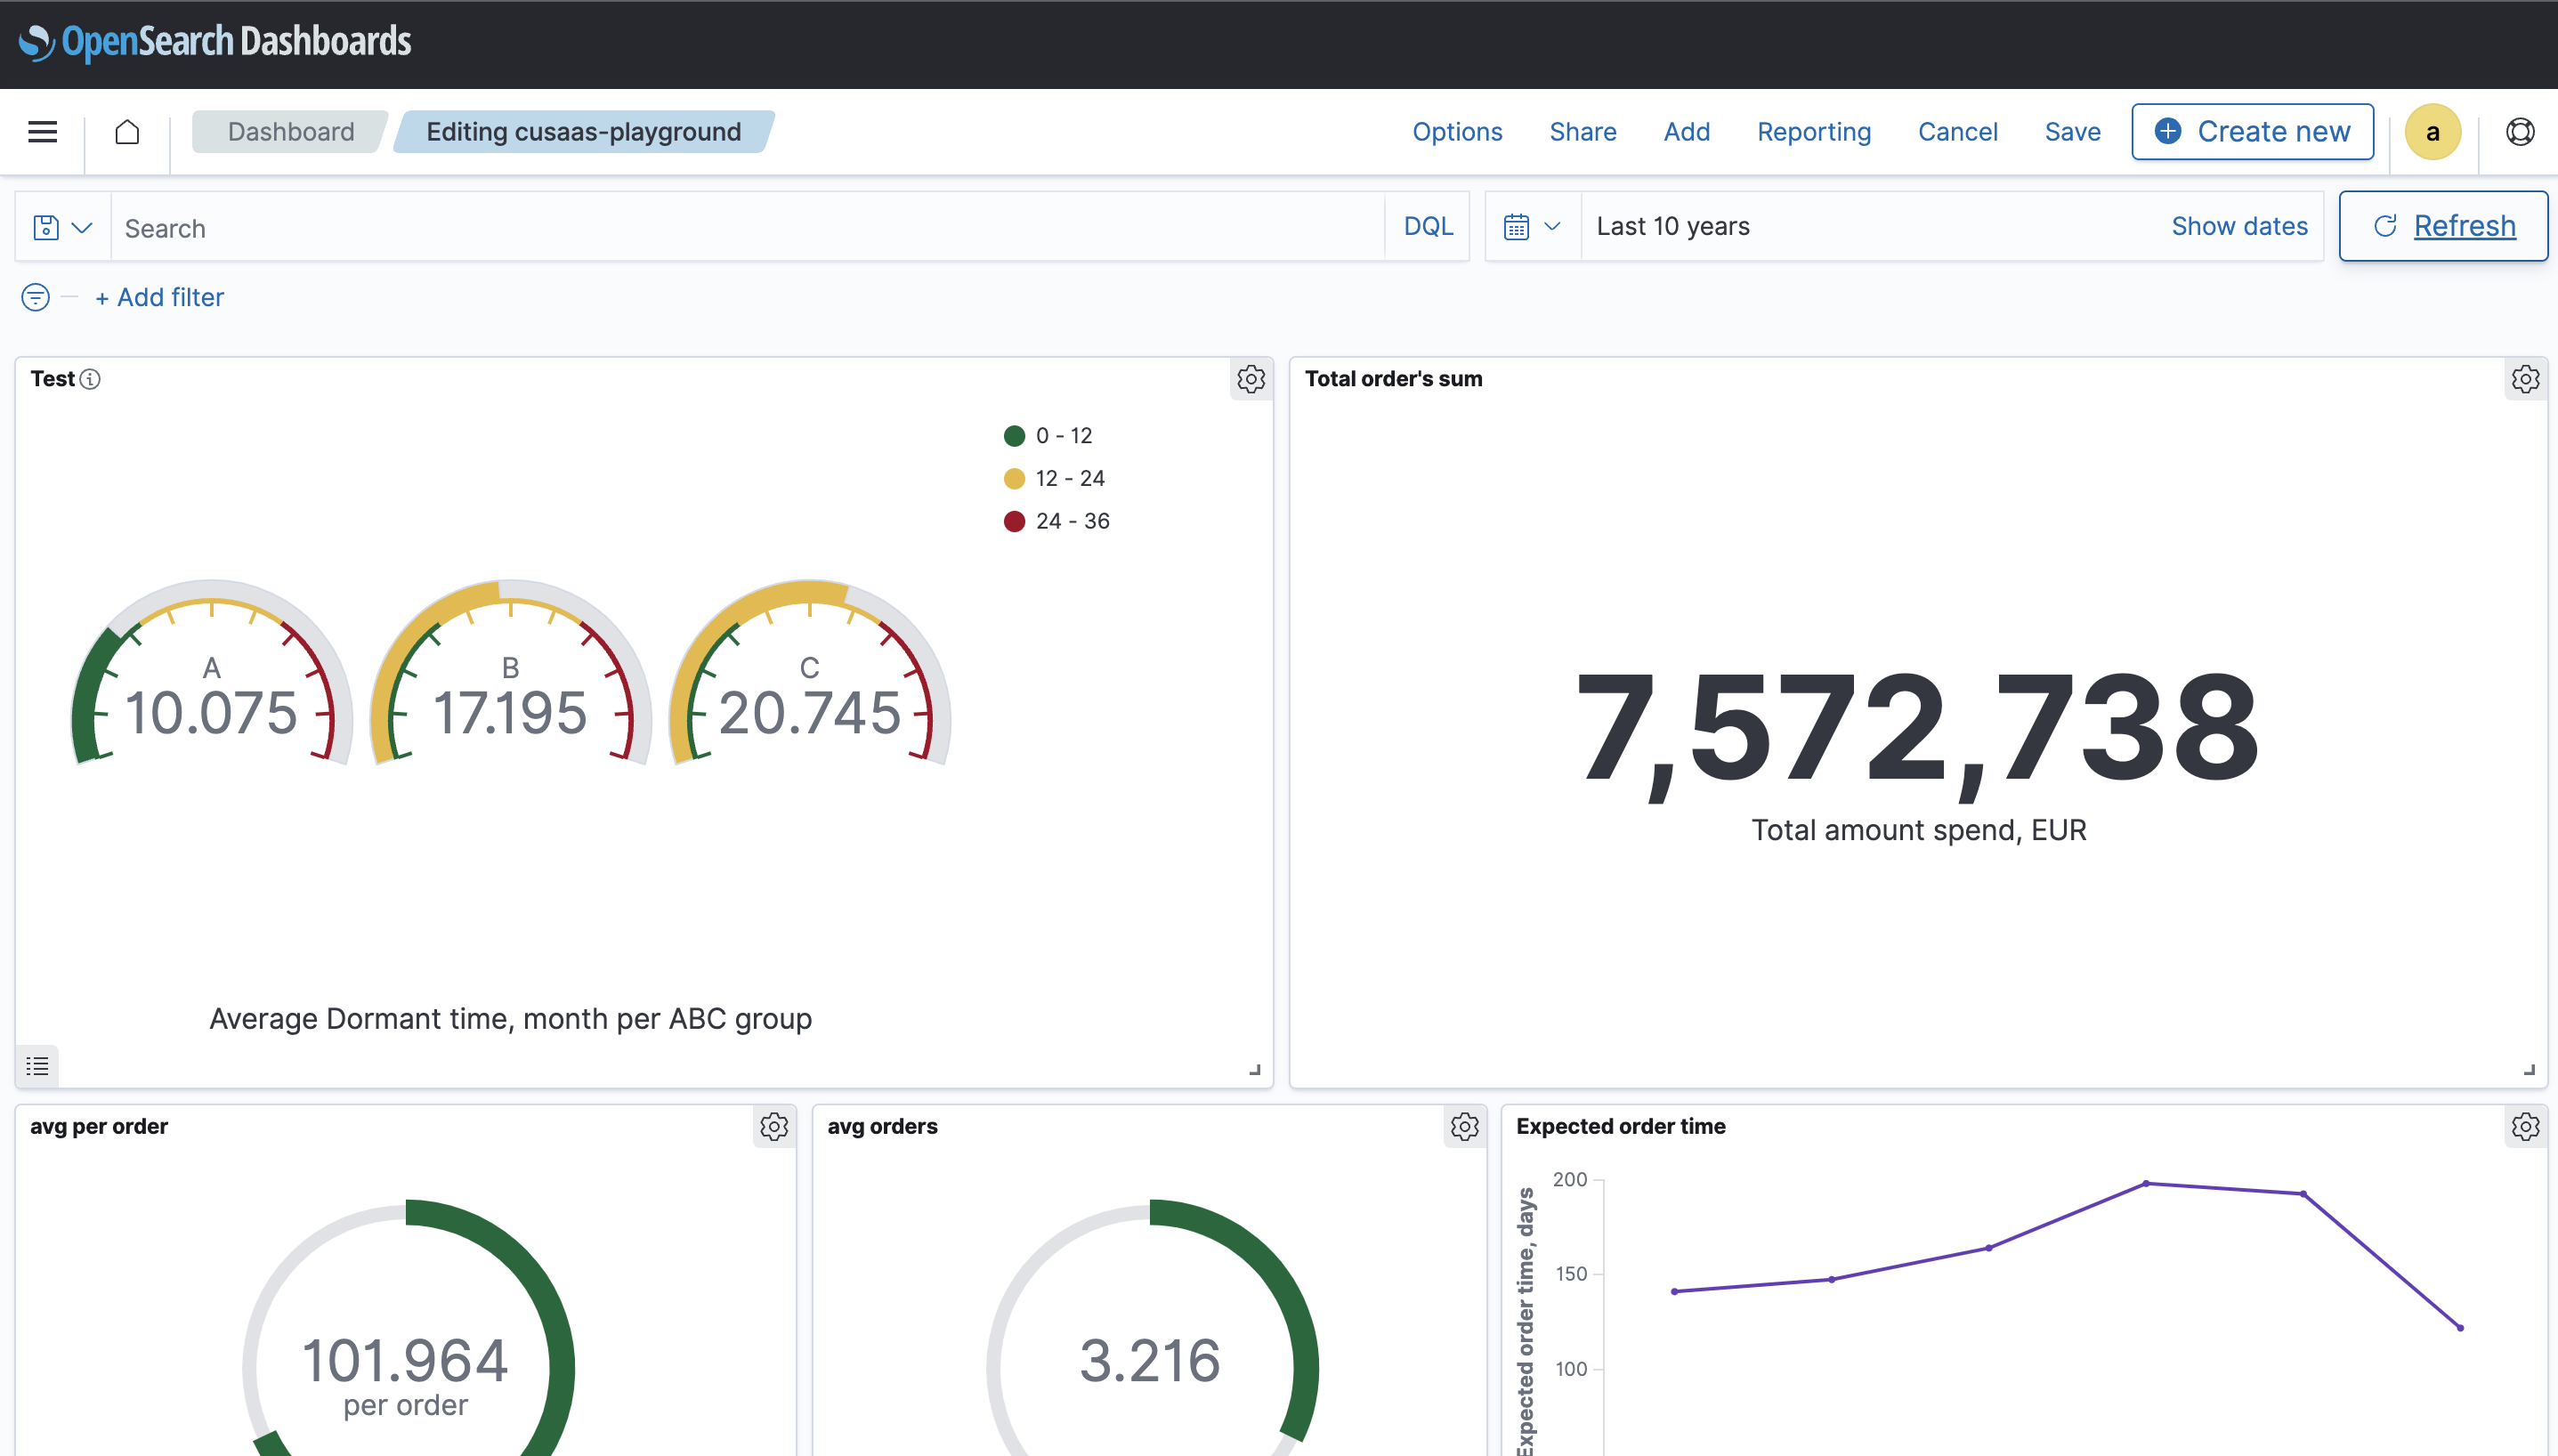
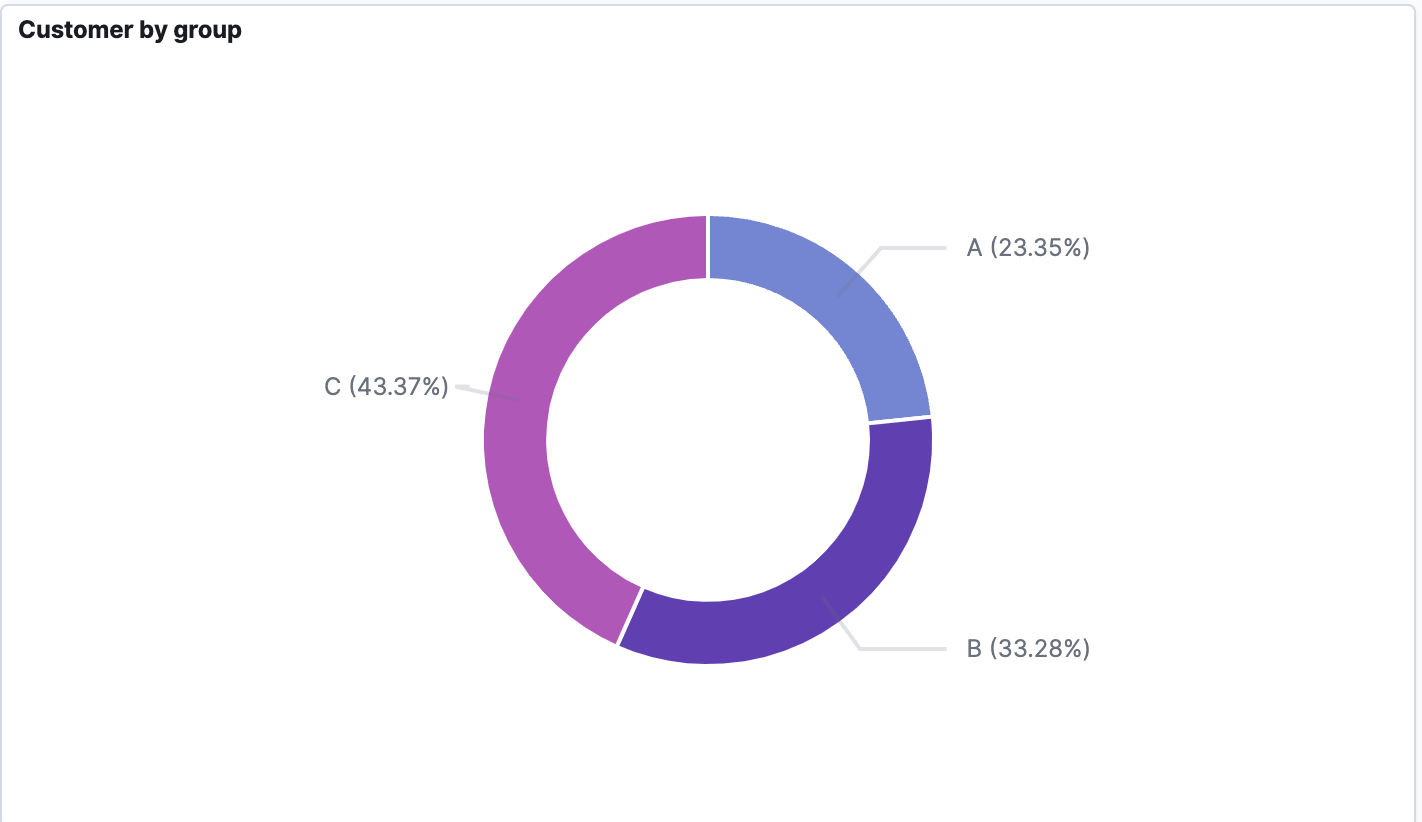
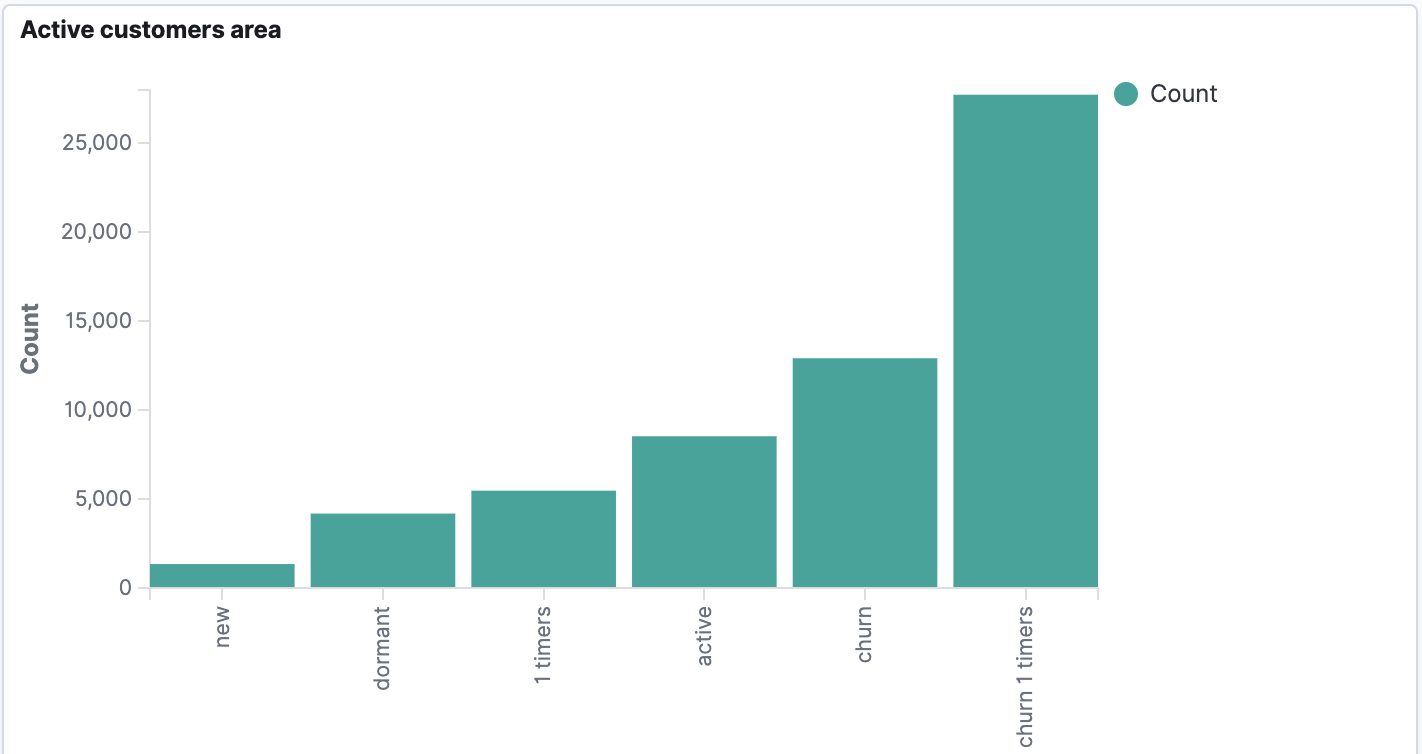
Visualisation
To visualize the data first we need to create an index pattern for our index. This is needed to match to our indexes by name, this way we can visualize data from different indexes, for example, if we have data from different years in the separate indexes with year suffix. (index_name_2020, index_name_2021 etc. can be used with index pattern index_name* ). Then we can proceed with the desired visualisation.