How to Use Chupper: The Churn Predictor
Customer churn can be a costly problem for any business. It is very useful to predict which customers will remain loyal in the future and which are at risk of churn. This is where Chupper, a Shopware app for churn prediction, comes in. In this article, we'll take a look at how to use Chupper to predict customer churn and reduce the risk of losing valuable customers.
Chupper in the Shopware Store
Acquiring and Installing Chupper
To use Chupper, you first need to acquire the app from the Shopware app store.
Once you have acquired the app, you can install it in the administration by
going to Extensions > My Extensions. Don't forget to activate the
app via the button to the left of the extension.
Chupper Indicators
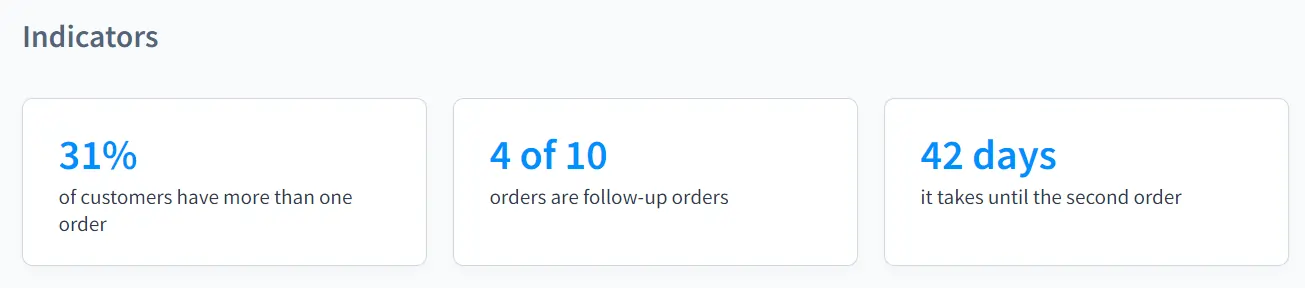
Once you have Chupper installed, you can start analyzing your customer data and predicting which customers are at risk of churn. After installation, Chupper can be used directly. At the top of the app interface, there are three indicators:
- Percentage of customers who have made more than one order: These customers are less likely to churn. With the help of this indicator, you can determine how many customers remain loyal after the first order.
- Number of follow-up orders: This indicator shows you the proportion of orders made by existing customers. Follow-up orders are important because they are a sign of your customers' loyalty and commitment to your brand.
- Days to next order: This indicator shows how many days pass before an average active customer makes their next purchase.
Chupper tables
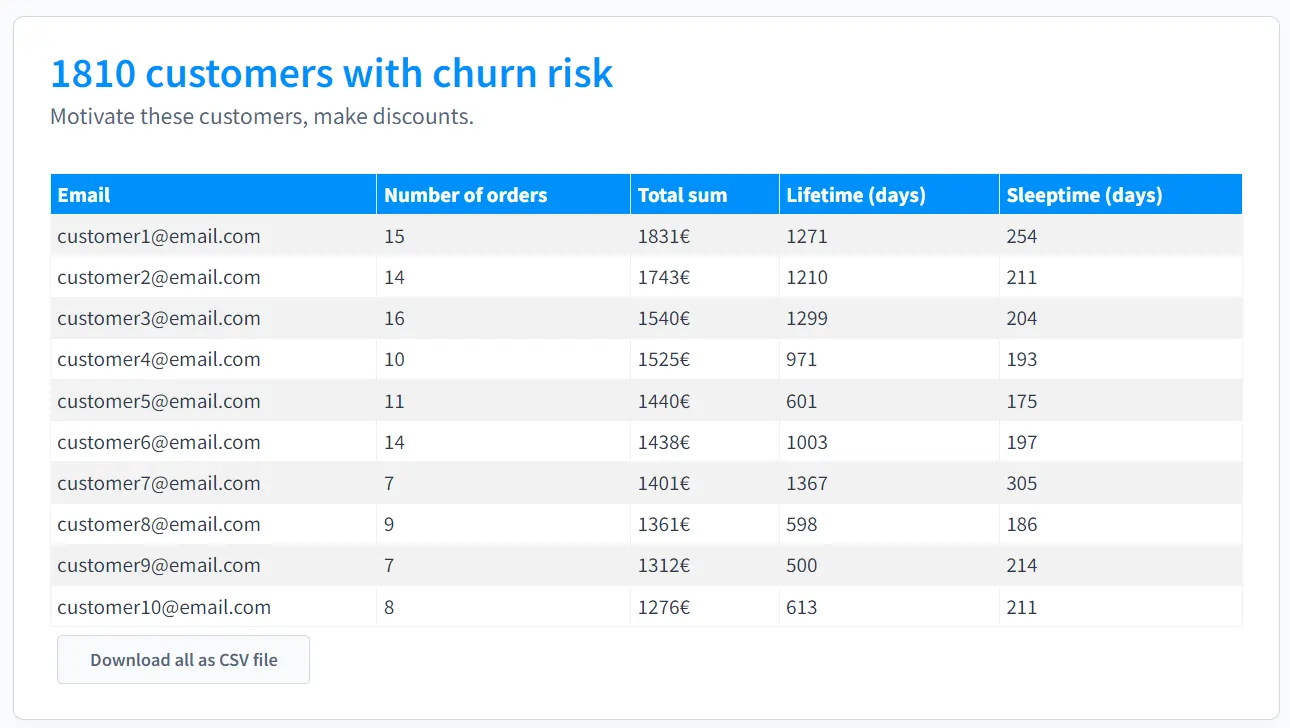
Chupper provides two tables for customer analysis: "Customers with churn risk" and "Customers with order potential." These tables provide the following columns for customer analysis:
- Email: The email address of the customer
- Number of Orders: The total number of orders the customer has made
- Total Sum: The total amount the customer has spent
- Lifetime (days): The length of time between a customer's first and last purchase
- Sleeptime (days): The time since the customer's last purchase
Using these columns, you can identify at-risk customers and create targeted campaigns to retain them. You can also identify customers with order potential and create campaigns to encourage them to make additional purchases.
In the Chupper interface, only the top 15 customers are shown in each table. These are the customers with the highest total order sum in the segment. The entire table with all customers of the segment can be downloaded in CSV format.
Hint: In the CSV file the segments are defined even more precisely.
- Customers with order potential are divided into new customers and active customers.
- Customers at risk of churn are split into One-Timer and Dormant. Dormant customers are those who were active in the past but have not placed an order recently.
Taking Action
Chupper provides you with a list of customers who are at risk of churn. For example, if Chupper detects that a customer has not shopped for several months, it is recommended to send them a personalized offer or discount to encourage them to store in your store again.
Info: Order data is synchronized and analyzed daily, so the list of "customers at risk of churn" is always up-to-date.


