Process Mining Fundamentals
The fundamental principles of process mining using Microsoft Power Automate as an example
In the era of data-driven decision-making, businesses are constantly searching for ways to optimize their operations and gain a competitive edge. One powerful tool that has emerged to help achieve these goals is process mining. It is used to analyze details of your business processes, identify bottlenecks and enhance overall efficiency. This is the essence of process mining—an innovative approach that holds the potential to revolutionize how organizations analyze, understand, and improve their processes.
This technique creates a data-driven perspective of how processes are actually executed, rather than how they were designed to be executed. By analyzing event logs generated by various systems and applications, process mining reveals the sequence of activities, decision points, and interactions that occur during the execution of a process.
Process Mining Data
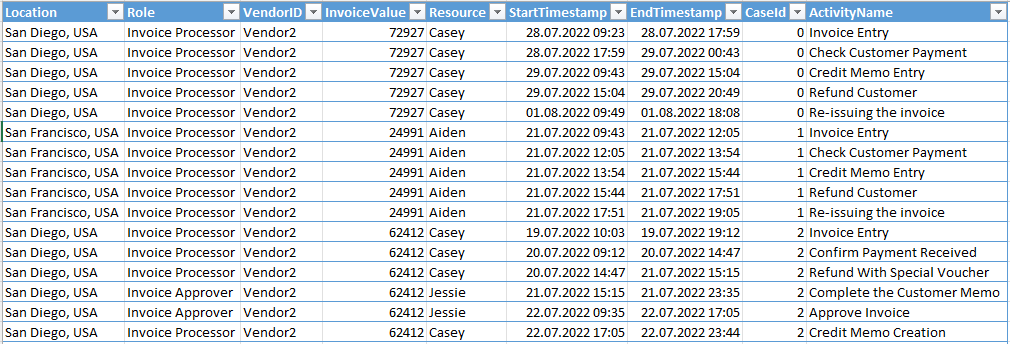
The minimal requirement to the log data are the following three columns:
-
Case ID: This column holds a unique identifier for each case or process instance. It links together all related events and actions, allowing for the reconstruction of individual process paths.
-
Activity Name: Each event corresponds to an activity or task within the process. The activity name column documents the specific activity being executed.
-
Timestamp: The timestamp column records the exact date and time when an event occurred. This temporal dimension allows for the reconstruction of the chronological order of activities.
To enhance the precision of process mining outcomes additional colums can be added. Some examples of these columns are:
-
Resource Identifier: In cases where multiple resources or individuals are involved in executing activities, the resource identifier column specifies who performed each action.
-
Event Type: Event logs often include a column indicating the type of event. Events can be categorized as starting events, completing events, or even error events.
-
Duration: The duration column calculates the time taken to complete an activity. This information is valuable for finding activities that consume many time.
The picture below displays a section of sample data, including both the basic information and additional attributes.
Process Map and Variants
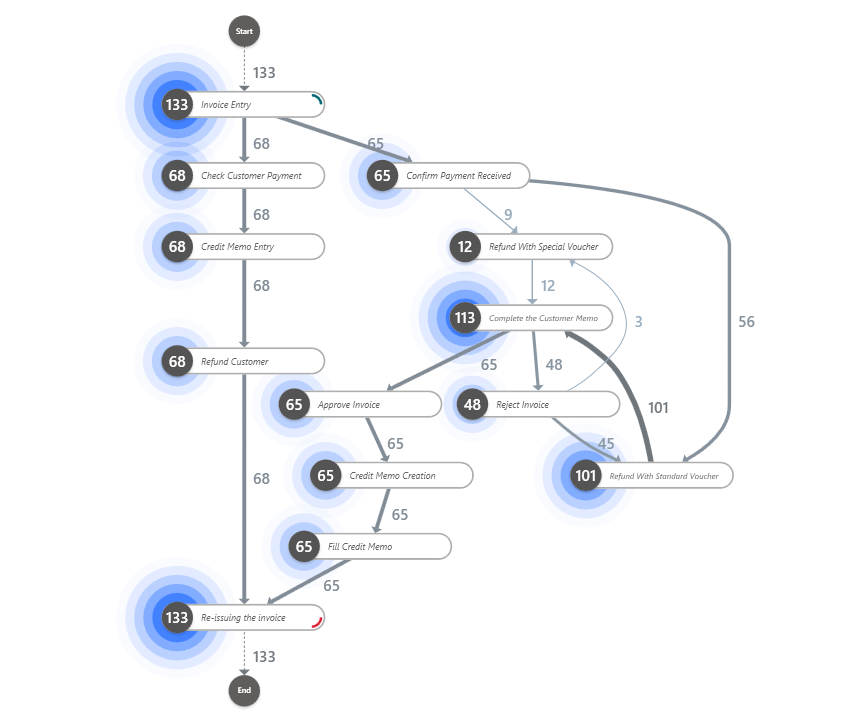
Based on the input data, Power Automate Process Mining can create a process map. On this map, the activities are displayed and their order is marked with arrows. The numbers indicate how many times an activity has been performed. Special cases, such as loops or branches, can be identified on this map. Real-world business processes are much more extensive and may include hundreds of possible paths from start to end.
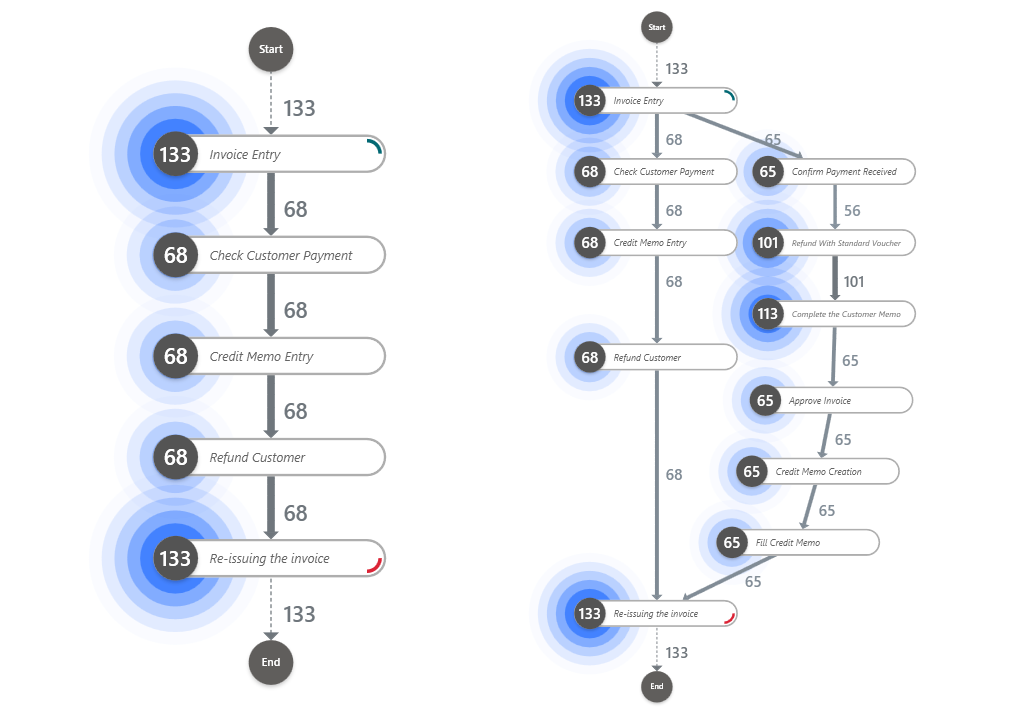
It is possible to limit the number of activities shown on the process map. If you display only the minimum number of activities, you will see the "happy path", the optimal version of how the process should be executed. If you display more activities, you will see two of the most common paths in the example. The second path shows a process path with more activities.
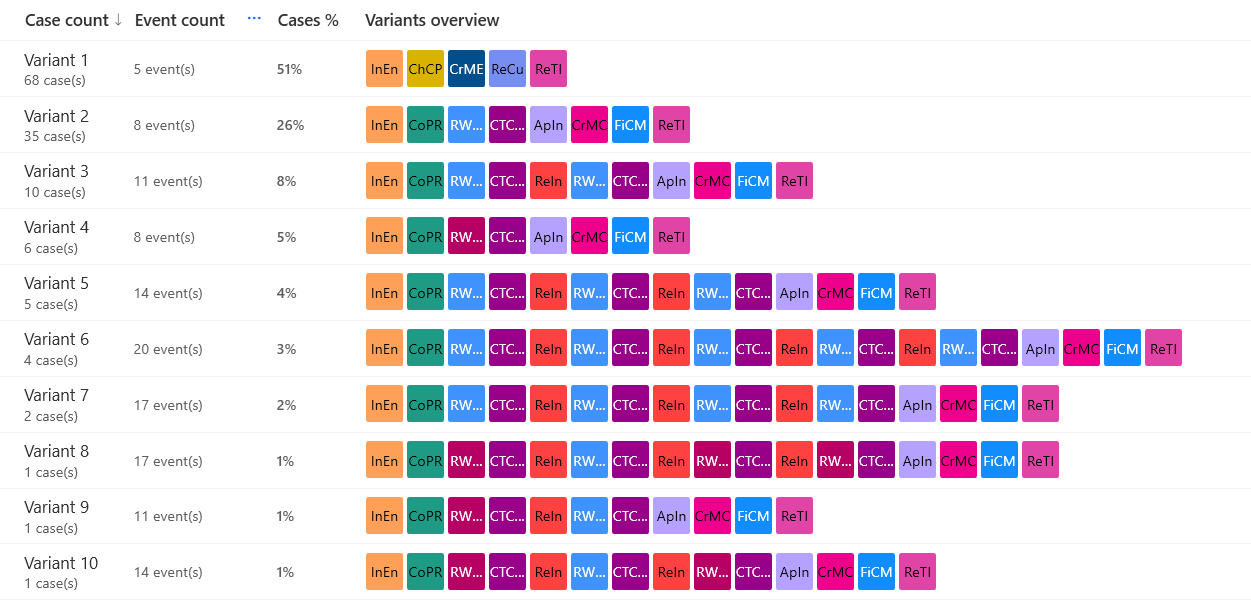
The variants show all possible process paths that occur in the data. The "happy path" with only 5 activities is the most frequently executed variant with 51% of the executions. The longest path (variant 6) shows the loops that ultimately led to the longer execution time. In this variant, the invoice was rejected four times (ReIn: Reject Invoice activities) and only approved on the fifth attempt (ApIn: Approve Invoice activity).
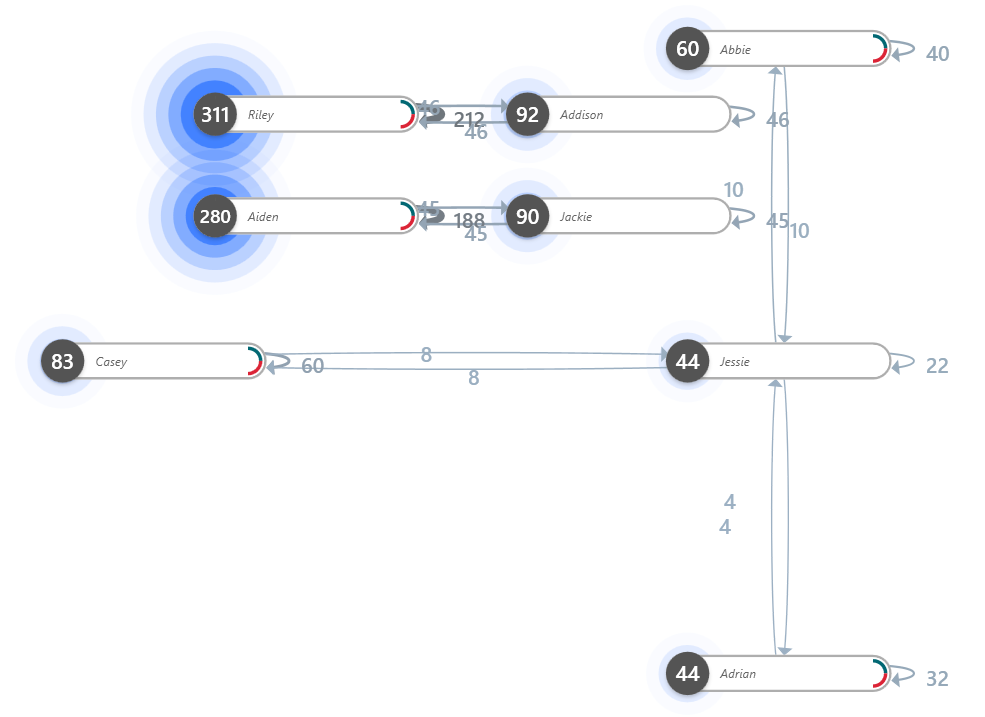
Social Chart and Hierarchies
The additional data helps to generate other visualizations besides the process map. When information about the individuals responsible for specific activities is available, it becomes possible to generate a social chart. This social chartreveals how individuals collaborate within a process. For instance, the illustration shows that Riley and Addison work together.
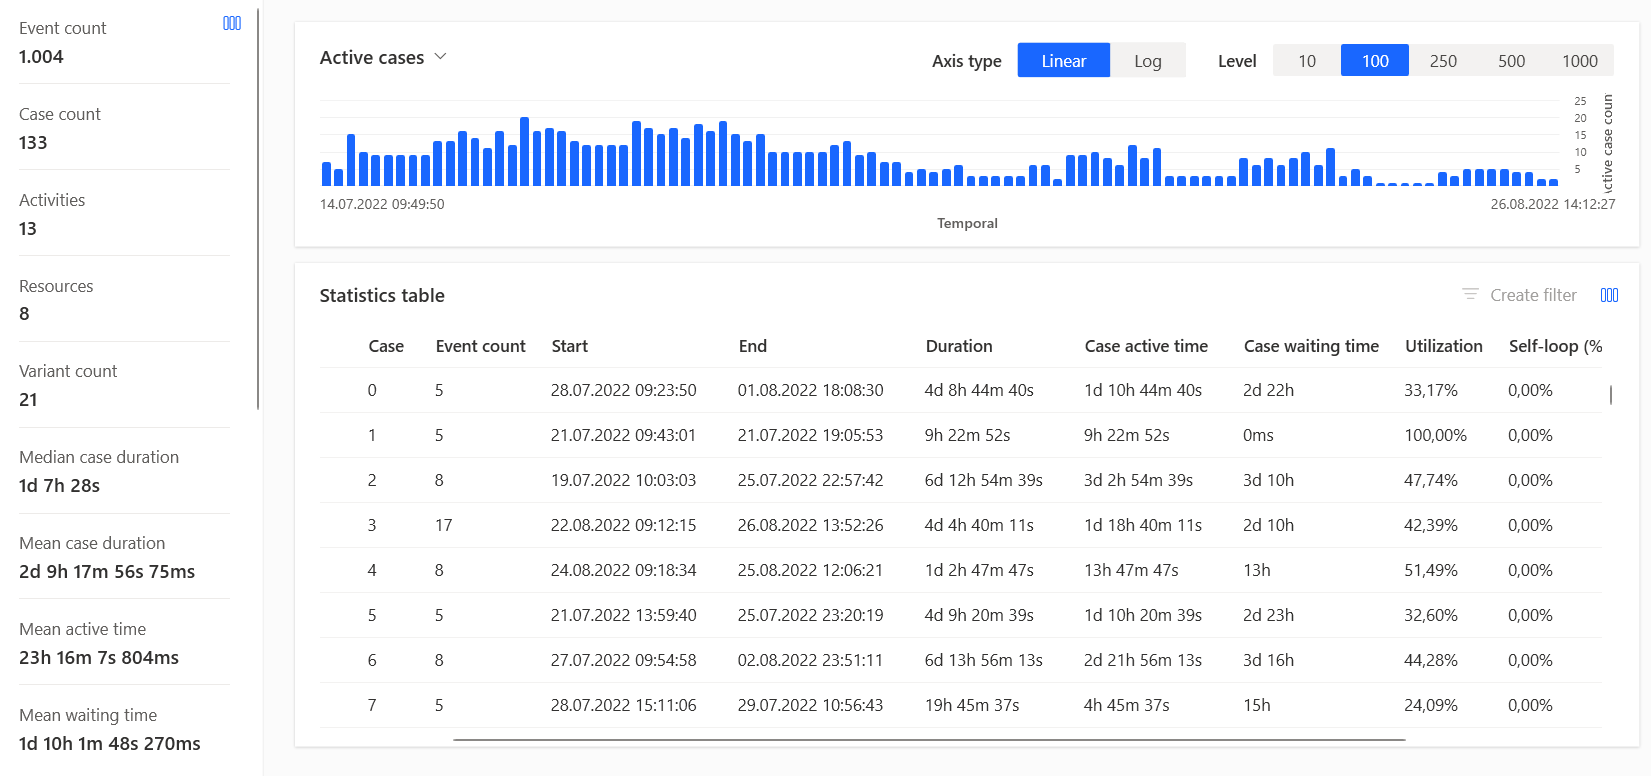
Statistics
The statistics part presents a comprehensive overview of various process performance metrics. Users can access key indicators such as process duration, case count, and event count. This metrics are very helpful to understand the process and to estimate the process complexity and optimization potential.
Conclusion
In conclusion, embracing Process Mining is a strategic move for organizations aiming to elevate their operational efficiency. By delving into the details of business processes, it provides a real-time view, enabling data-driven decision-making. Unveiling bottlenecks and inefficiencies allows for targeted improvements and optimized resource utilization. The visual representation of processes adds a layer of clarity, empowering teams to proactively address issues and drive continuous enhancement.


