From Data to Action: Our Condition Monitoring Insight
In today's industrial landscape, the need to ensure operational efficiency and reliability has given rise to the strategic discipline known as condition monitoring. At its core, condition monitoring is a proactive methodology that goes beyond traditional maintenance practices to provide real-time assessments and analysis of machinery and equipment performance. This article delves into the realm of condition monitoring, anchored in the context of a tangible, implemented project.
The ambitious condition monitoring project has been realized within the "Mittelstand Digital Zentrum WertNetzWerke" network, a community of which our company is proud to be a part. The collaborative synergy fostered by WertNetzWerke has cultivated an invaluable ecosystem, pushing our efforts to the forefront of digital transformation in industrial operations. As we navigate the features of condition monitoring in this project, we are grateful for the support and inspiration we have received from our participation in this dynamic network.
Our key collaborator in this project is Wichelhaus & Co, a company that has been instrumental in shaping the trajectory of our project. Their invaluable contribution is the provision of comprehensive data from their machines, a cornerstone of our exploration into condition monitoring. The partnership with Wichelhaus not only enriches our analysis, but also underscores the practical applicability in a real-world industrial context.
Fundamentals
At the heart of this methodology is a sophisticated set of sensors and data analytics. This combination is used to carefully monitor machines and detect changes in behaviour that may indicate potential problems. By identifying these problems in their early stages, condition monitoring enables organizations to initiate timely and targeted maintenance interventions. The result is minimized downtime, optimized resource allocation and a significant increase in overall operational efficiency.
As we dive deeper into the world of condition monitoring, it becomes clear that its effectiveness is closely tied to three fundamental aspects: Data Processing, Visualization and Automation. These elements not only shape the methodology, but also illuminate the path to operational excellence. In the coming sections of this blog, we will explore the nuances of data processing, uncover the importance of visualization in deciphering complex information, and observe how automation plays a transformative role in streamlining the condition monitoring process.
Process
Before getting down to the fine-grained work of data preparation, it is important to lay the groundwork with a well-defined concept. This includes articulating clear goals and an initial set of requirements for the dashboards. In our context, the overarching goal was to create two distinct dashboards - one tailored for the management team and the other designed specifically for shop floor workers.
This design phase is critical because it serves as a compass to guide subsequent data processing efforts. The requirements outlined not only shape the trajectory of the data transformation, but also ensure that the resulting dashboards seamlessly align with the unique needs of their intended users.
A pivotal component of our project lies in its agile methodology – an iterative cycle that embraces the dynamic nature of data, requirements, and dashboards.
This agile approach is similar to a continuous loop in which new requirements emerge that require adjustments to our data transformation processes. As new insights are gained and operational needs evolve, the adaptability of our data transformation becomes essential. It's a dynamic dance that ensures our data assets remain finely tuned to the pulse of changing requirements.
At the same time, this iterative evolution extends to our dashboards. Each cycle yields new insights that drive refinements in our visual representations. Whether it's a shift in focus, the inclusion of additional metrics, or the enhancement of user interface elements, our dashboards evolve in tandem with the evolving needs of management and shop floor personnel.
1. Step: Data Processing
In the realm of best practices, the foundation for creating effective dashboards lies in the careful preparation of data specifically tailored for visualization. Attempting to visualize raw, unprocessed data can lead to limitations in presenting the desired widgets and insights, as preprocessing becomes a necessary precursor. This section delves into the nuances of making data dashboard-ready, exploring the methods and practices essential to unlocking the full potential of your data.
Initial data
As part of our Condition Monitoring process, our analysis begins by examining the log data generated by Wichelhaus & Co Machines, which is structured in CSV format. Each log entry corresponds to the production of an individual component.
Within these datasets, critical metrics take center stage – specifically, the duration and resource consumption associated with each production instance. In addition, warning and error information is included in the data, providing insight into potential anomalies or problems during the production process.
This data set, received in the form of one file per day, provides an accurate representation of the temporal aspects of the production process and sheds light on the efficient use of resources. The data, in its granular form, serves as a fundamental element in understanding the intricacies of machine performance, providing insight into both production efficiency and resource optimization.
Transformation
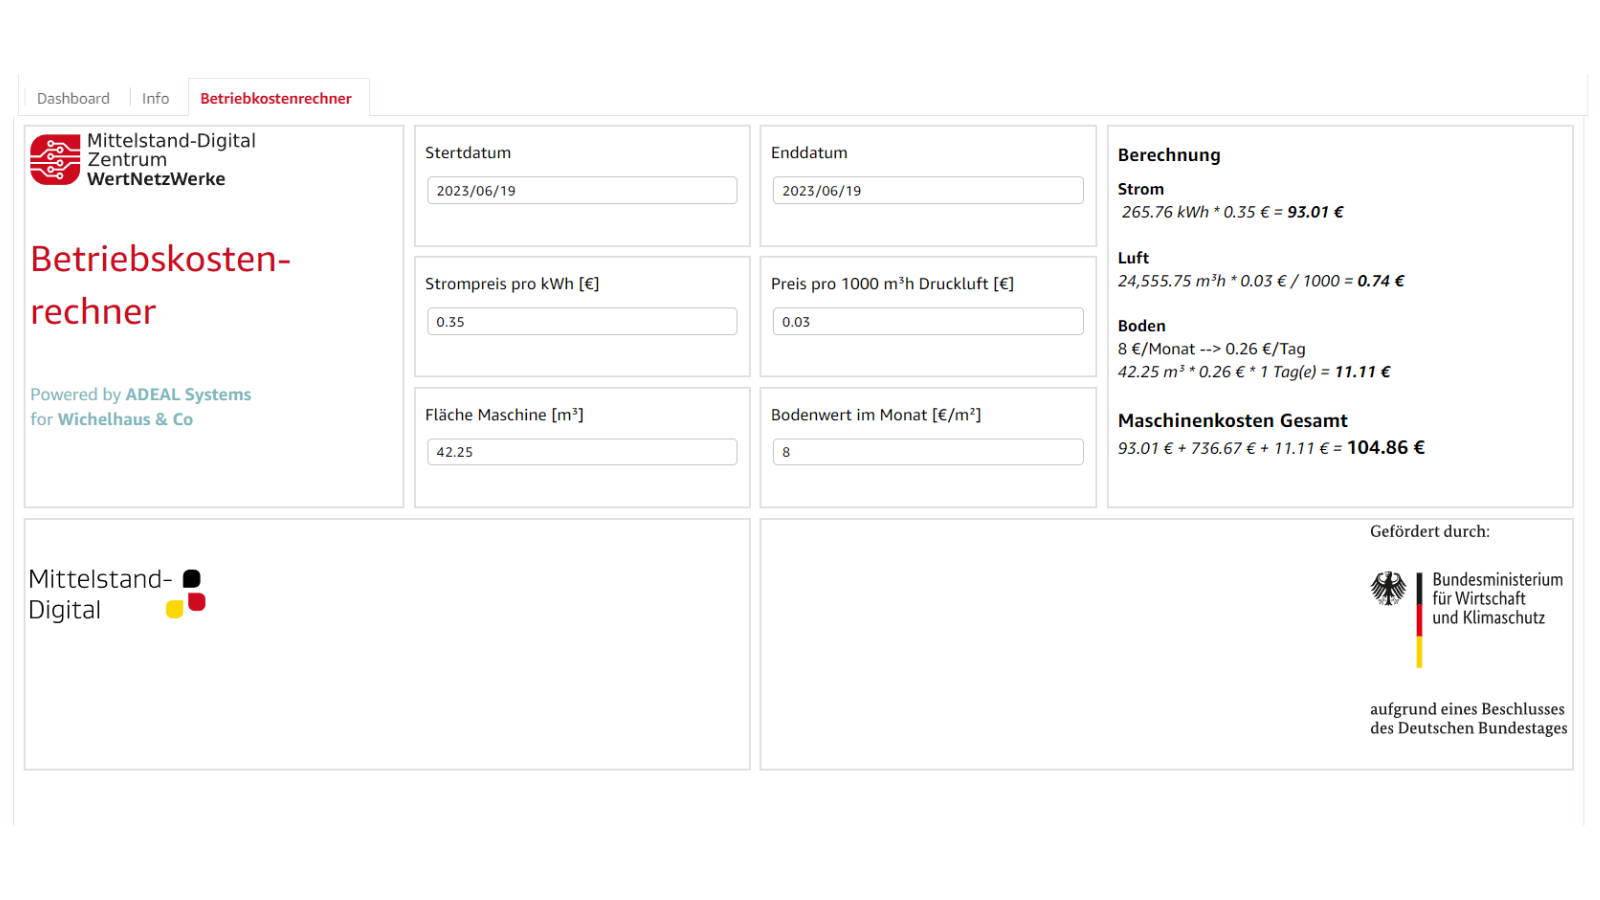
It is considered best practice to create a dashboard-specific dataset. To accomplish this, we implement two distinct data pipelines, each tailored to meet the unique requirements of the dashboards we intend to build.
The first pipeline is dedicated to feeding the management dashboard. It focuses on hourly aggregated data that includes key metrics such as resource utilization, parts produced, associated costs, and downtime. This refined dataset is designed to provide a comprehensive view, allowing management to gain a comprehensive view and make informed decisions based on consolidated and strategic insights.
At the same time, the second data pipeline feeds the Shop Floor Dashboard. Here, the focus shifts to detailed data on warnings and errors, including metrics such as frequency, duration, and specific details. This level of granularity empowers shop floor operators with information, facilitating a proactive response to potential issues and ensuring seamless operations.
2. Step: Visualization
The Visualization section is the key that unlocks the art and science of transforming data into actionable intelligence. At the forefront of this visual journey in our project are two Quicksight dashboards: Shopfloor and Management. These dashboards act as windows into the intricate workings of machine health and performance, providing distinct perspectives tailored for both shopfloor operators and management stakeholders. Each dashboard is designed to meet the specific needs of its particular target user, ensuring a seamless and insightful experience.
Management dashboard
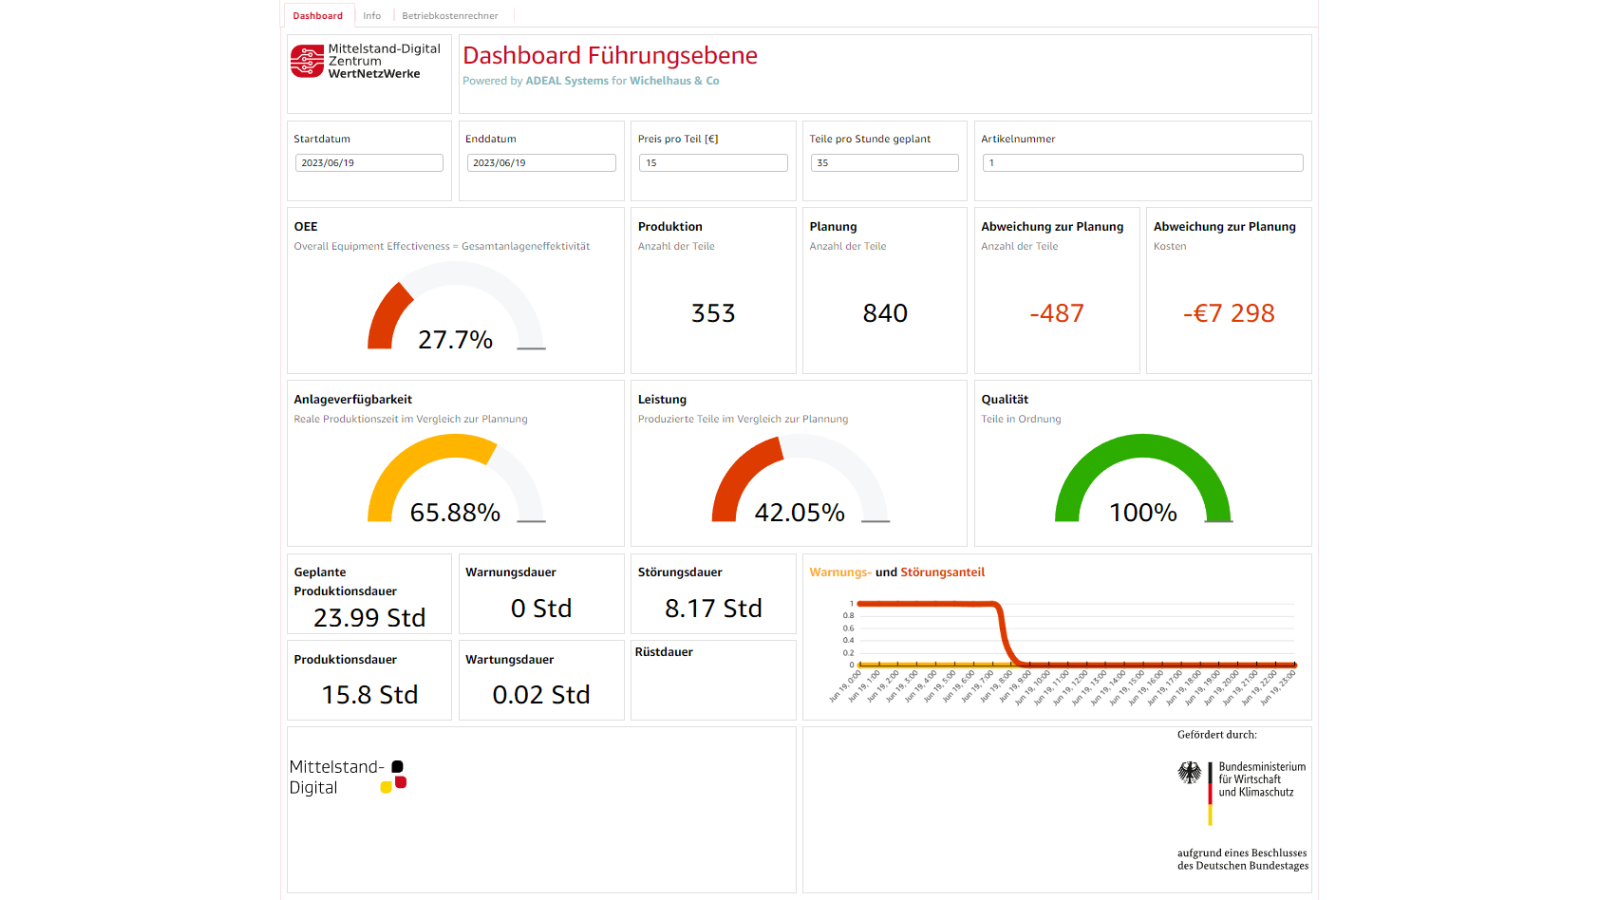
The management dashboard emerges as a key tool in our condition monitoring initiative, designed to provide a high-level view of machine performance. This formal interface, tailored for management oversight, goes beyond the conventional boundaries of visualization to provide a high-level view of operational dynamics.
The management dashboard is a strategic tool that distills hourly aggregated data into actionable insights. This executive-level view includes key dimensions such as resource utilization, part production, associated costs, and downtime. In addition, the dashboard expands its functionality to include critical key performance indicators (KPIs) such as Overall Equipment Effectiveness (OEE). This addition enhances the management toolkit by providing a comprehensive perspective on the efficiency and productivity of production processes.
This formal dashboard facilitates strategic decision-making by allowing executives to delve into historical trends and patterns. Armed with this foresight, management gains the ability to anticipate challenges, optimize resource allocation, and improve overall operational effectiveness.
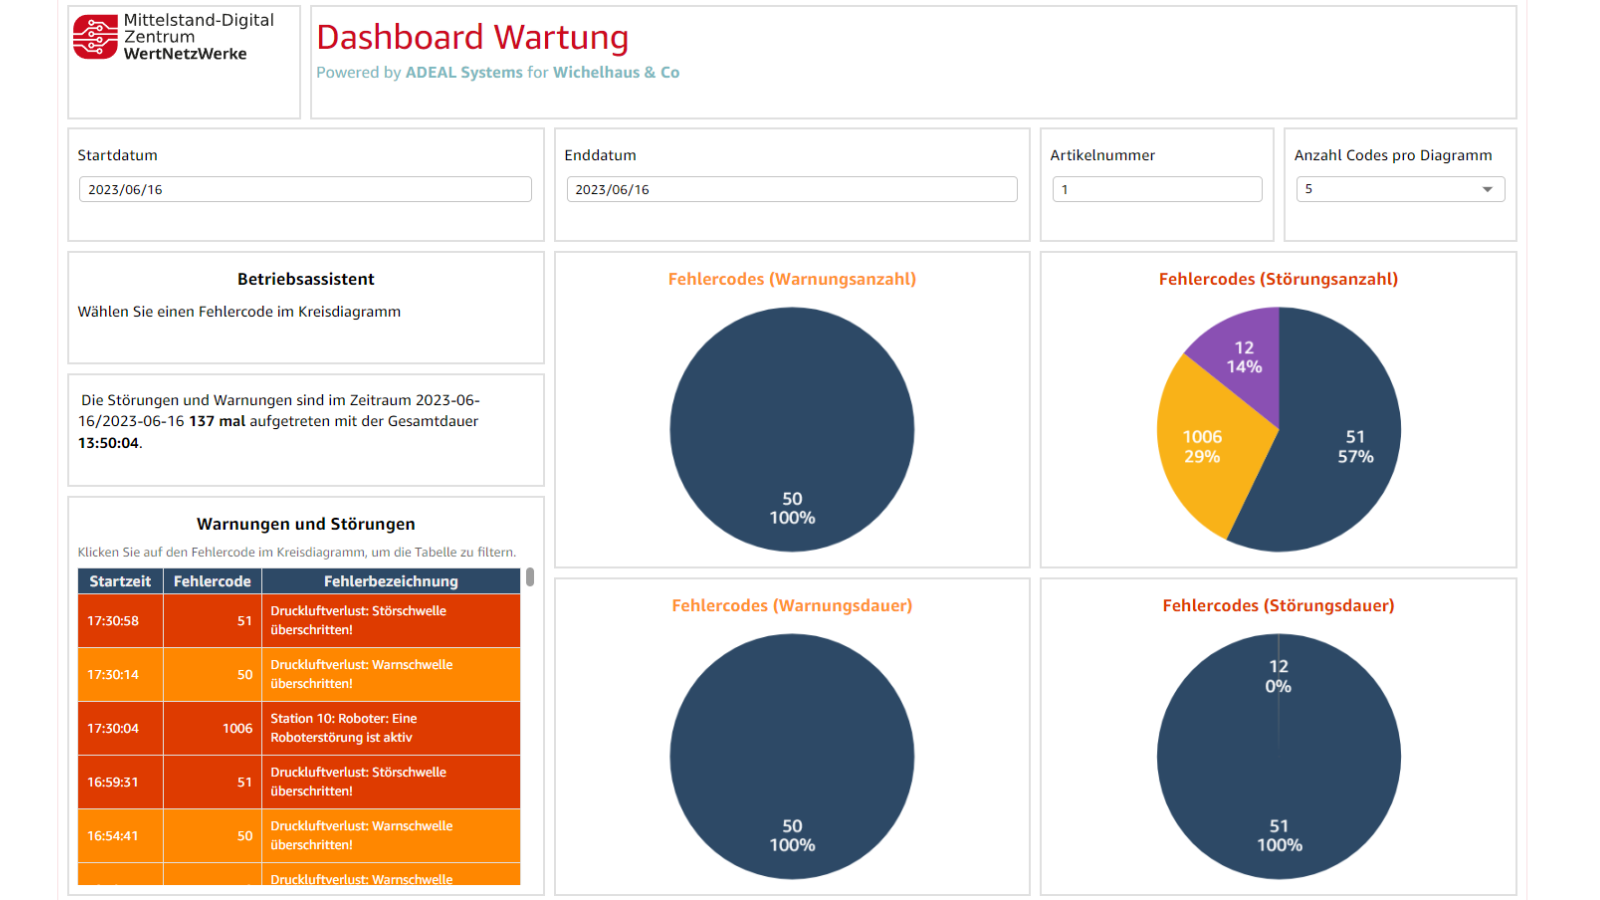
Shopfloor dashboard
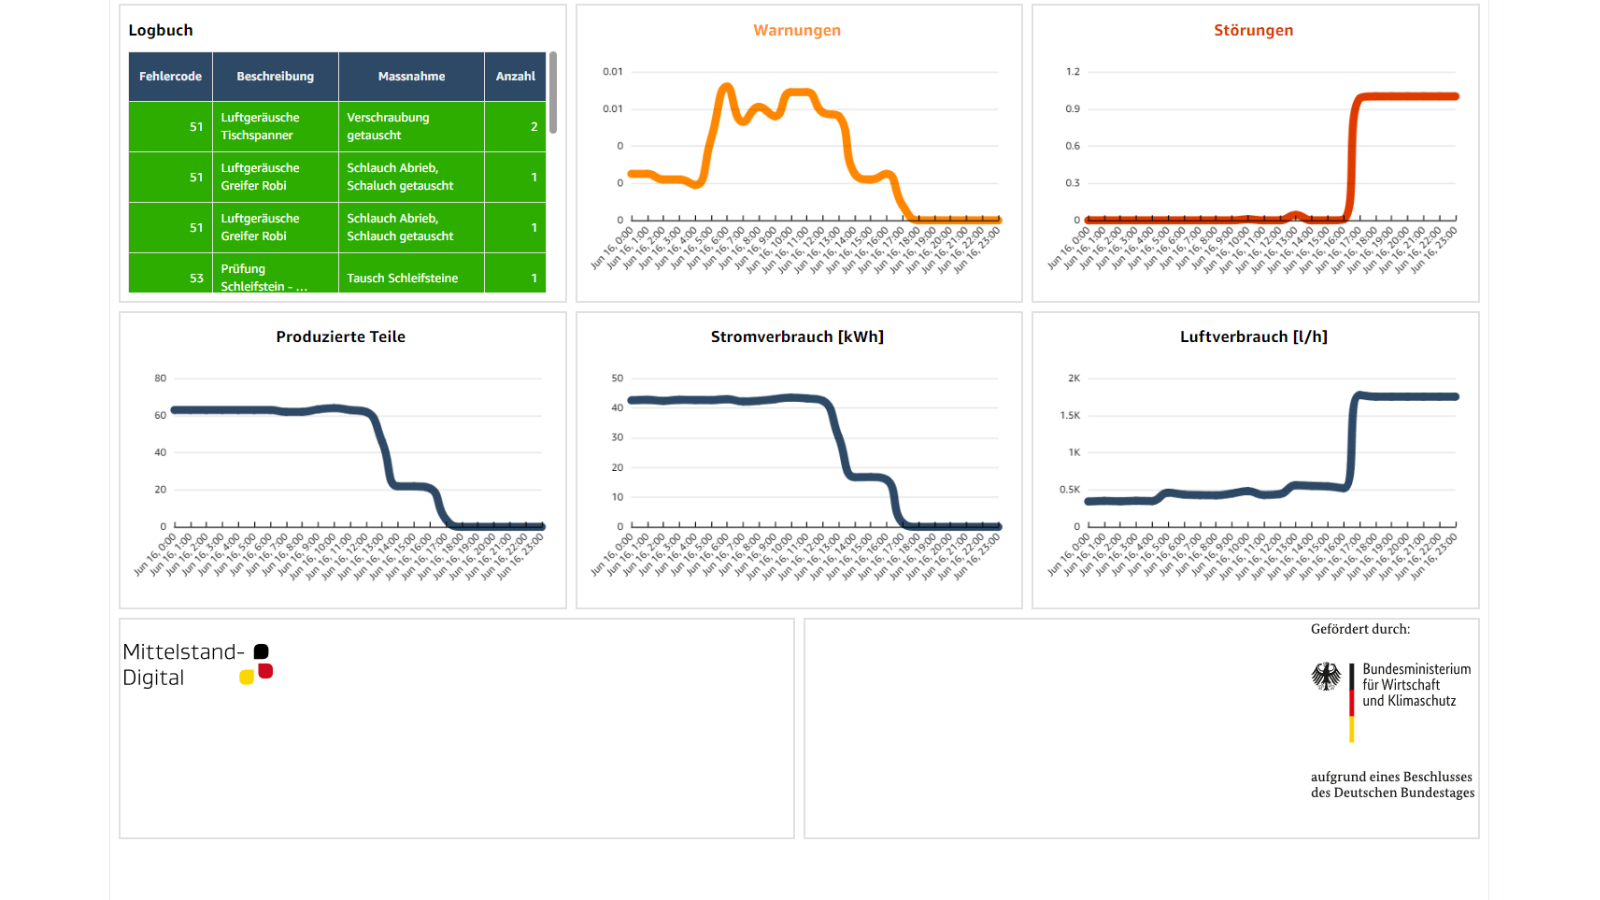
Central to our condition monitoring infrastructure is the shop floor dashboard, a meticulously crafted interface designed to improve operational efficiency. More than just a display of metrics, the Shop Floor Dashboard serves as a strategic asset for operators. Offering in-depth analysis, it not only reveals the granular details of warnings and errors, but also provides historical perspectives on error resolutions, where documentation exists. This feature enhances the utility of the dashboard, allowing operators to gain insight into past corrective actions and make informed decisions.
In addition, the dashboard includes advanced features such as time filtering and resource usage analysis. These features contribute to a holistic understanding of the reasons behind warnings, enabling operators to delve deeper into the intricacies of production issues. This formal and comprehensive tool serves as a cornerstone in our commitment to seamlessly integrate technology into the operational fabric to ensure a resilient and efficient shop floor environment.
3. Step: Automation
Incorporating Amazon Web Services (AWS) into our condition monitoring initiative adds a powerful layer of automation that improves overall efficiency. By leveraging AWS services, we streamline key processes from data processing to dashboard updates. This integration extends beyond the backend to permeate the user experience, ensuring timely insights for both shop floor operators and management. Scheduled updates play a key role in fostering a proactive decision-making environment, increasing the agility and responsiveness of our system.
Conclusion
To sum up our exploration into condition monitoring, we've traversed a practical path from initial data analysis to refined dashboards. The shop floor and management dashboards aren't just visualizations—they're tools designed for real-world impact.
Our agile approach ensures adaptability as industrial needs evolve. These dashboards offer insights and practical solutions for both shop floor operators and managers. Through detailed data and performance indicators, they become strategic assets for informed decision-making.
Explore our Condition Monitoring page if you're seeking a solution in this domain!


